
Continuous and Comprehensive Temperature Monitoring Control Cabinets
Predictive Maintenance and Smart Fire Prevention in Electroplating
In Germany, around 70 to 80 fires occur in electroplating facilities every year, some of which are caused by electrical control cabinets. Approximately 10 to 15 of these fires result in major losses exceeding €500,000. This makes it all the more important to detect thermal anomalies at an early stage, before they lead to unplanned downtime, significant property damage or safety risks. (Source: Gen Re)
Why is temperature monitoring so important in electroplating?
In electroplating, high electrical currents flow every day, placing continuous demands on equipment and its components. Rectifiers, pumps and numerous other system components rely on a reliable power supply. At the heart of this electrical infrastructure is the control cabinet, where power distribution and control systems come together.
Yet this is also where an often underestimated risk arises: contact resistance. It can develop due to loose connections, corrosion or worn contacts. When electrical current encounters increased resistance, heat is generated. If these temperature changes go undetected, components can overheat. In the worst-case scenario, this can lead to cable fires, equipment damage and costly production downtime.
Reliable monitoring of electrical components inside control cabinets and early detection of critical temperature changes can help reduce risks, prevent failures and improve the operational safety of the entire electroplating facility.
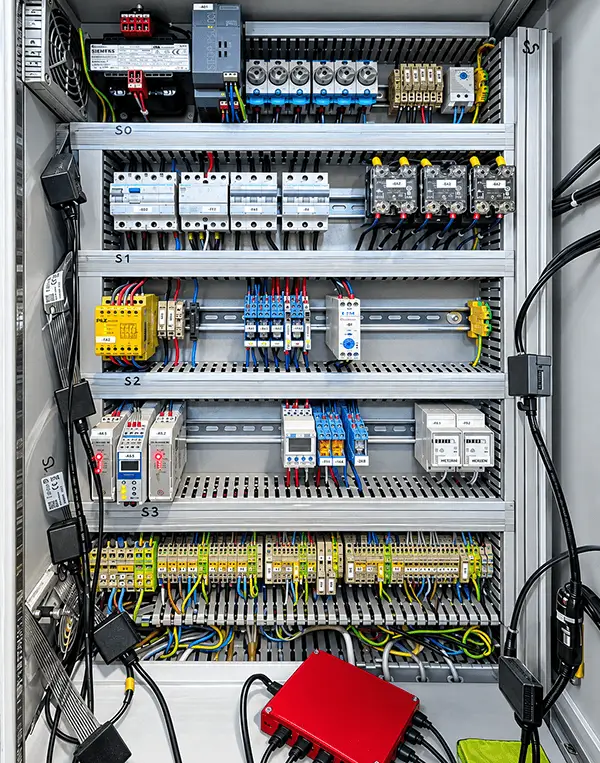
Aera-X temperature sensor foils installed inside the control cabinet
Flexora’s comprehensive and continuous temperature monitoring captures temperatures at numerous, spatially distributed measurement points. This reveals where heat develops, how temperatures change over time, and whether deviations from normal operating conditions occur. Flexora’s sensor films thus make an important contribution to predictive maintenance and early fire detection in control cabinets.
Temperature monitoring control cabinets: from spot thermography to continuos, comperehensive monitoring
Electrical installations and equipment must be inspected regularly in accordance with applicable legal and technical requirements. Depending on the application, this includes periodic inspections under the German Industrial Safety Regulation (BetrSichV) and DGUV Regulation 3, as well as supplementary thermographic inspections in accordance with DIN 54191. These measures are essential for electrical safety. However, they have one key limitation: they provide a snapshot of an installation’s condition at a specific point in time.
Predictive maintenance takes a fundamentally different approach. Instead of inspecting equipment exclusively at fixed intervals or performing maintenance only after a failure, condition data is continuously collected and analyzed. This makes it possible to detect changes in equipment condition at an early stage and derive appropriate maintenance measures before problems escalate.
Measurement campaign across three electroplating facilities
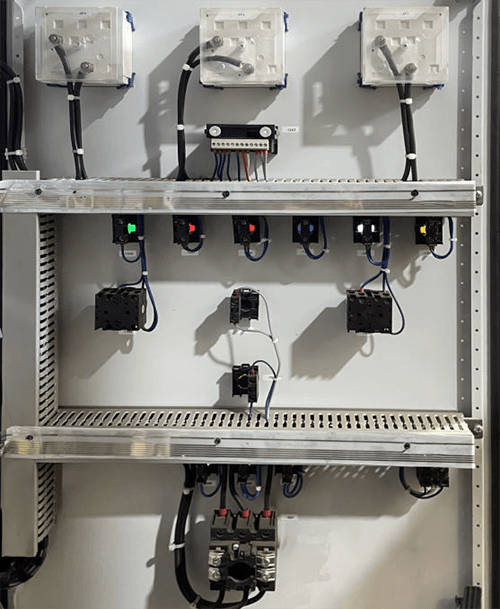
Temperature sensor foils for monitoring temperatures along the DIN rails on the control cabinet door
What additional insights can spatially distributed and continuous temperature monitoring provide compared to isolated spot measurements? In a multi-week measurement campaign, Flexora worked with three electroplating facilities to investigate its added value for early fire detection in control cabinets.
The Aera-X temperature measurement system from Flexora was used for this application. It consists of a read-out unit for collecting and transmitting measurement data, as well as flexible Aera-One temperature sensor foils, each equipped with seven temperature sensors. A single measurement unit can connect up to ten sensor foils simultaneously.
For temperature monitoring, eight to ten temperature sensor foils were installed in each of the control cabinets examined, providing a total of 137 measurement points. To monitor cabinet temperatures, Flexora sensor films were installed horizontally and vertically inside the cabinets and on the cabinet doors, according to the geometry of each cabinet (see picture). This enabled monitoring of both central and peripheral areas.
Over a period of approximately four weeks, around 60,500 measurement cycles were recorded. This generated a continuous time series that enabled the analysis of both long-term temperature trends and short-term thermal events. At the same time, the spatially distributed measurement points made it possible to determine whether heating affected the entire control cabinet or remained concentrated in a specific area.
Compared with conventional measurement methods, this approach offers two key advantages: high spatial and high temporal resolution. The large number of measurement points enables a much more detailed assessment of temperature distribution than individual point sensors. At the same time, continuous data acquisition at one-second intervals makes it possible to track thermal changes over time without interruption. With data recorded every second, thermal changes can be documented continuously, whereas conventional thermal imaging cameras provide only a snapshot in time.
Insights from continuous temperature monitoring in electroplating
The measurement campaign initially revealed largely unremarkable temperature profiles that correlated with operational load patterns. Average control cabinet temperatures followed identifiable daily and weekly trends and generally remained within a temperature range that could be explained by production cycles and ambient conditions.
However, only continuous temperature monitoring over several weeks revealed a distinct, intensifying trend at a single measurement point, superimposed on these expected fluctuations. A one-time inspection would likely have missed this development, as the absolute temperature remained within an apparently normal range at many points throughout the monitoring period.
Detecting local hotspots in control cabinets
The benefits of continuous monitoring were particularly evident at a local measurement point in one of the electroplating facilities studied. Analysis of peak temperatures at measurement point “blue 3” identified a localized area reaching temperatures of up to 55.2 °C, while temperatures elsewhere in the control cabinet remained significantly lower. The median temperature across the entire cabinet reached a maximum of approximately 34.6 °C during the measurement period.
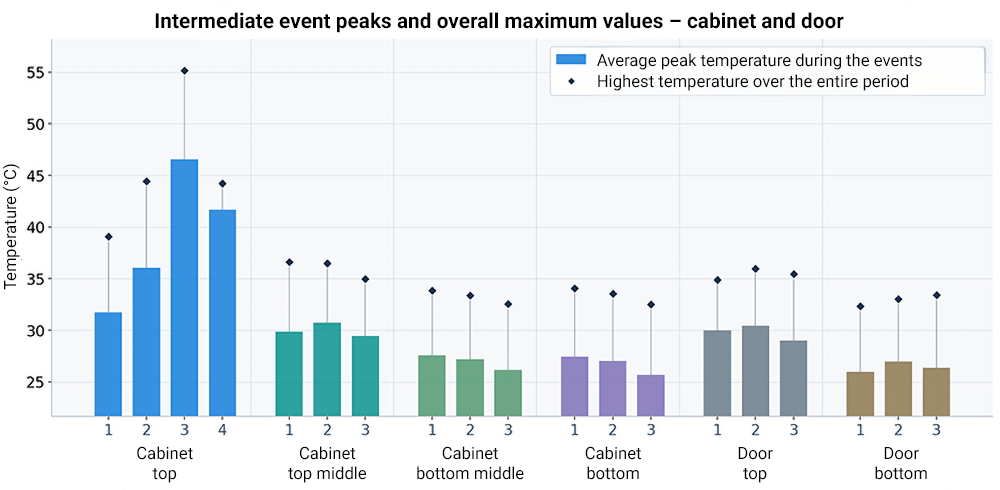
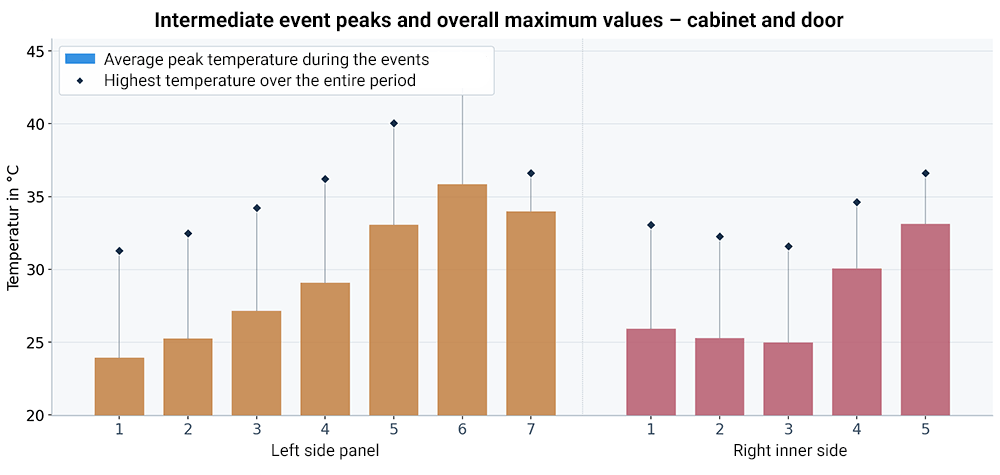
The spatial representation of the interpolated temperature field revealed not only the location of the hotspot but also its immediate surroundings. The elevated temperatures were clearly concentrated in the upper section of the control cabinet, while the areas below remained noticeably cooler. This made it possible to identify not only the presence of elevated temperatures but also their precise location and distribution across the surrounding area.
This spatial information adds another dimension to the analysis of temperature time series and can be relevant when assessing potential technical causes, for example, when investigating an electrical connection or component that may be exhibiting abnormal thermal behavior.
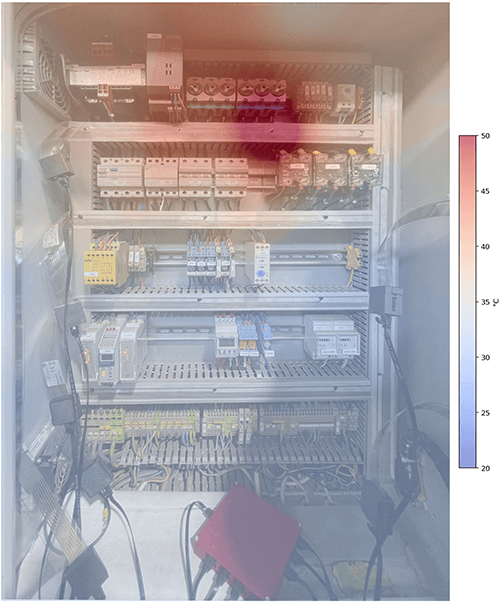
Spatial visualization of the local hotspot inside the control cabinet
Detecting gradual temperature changes early
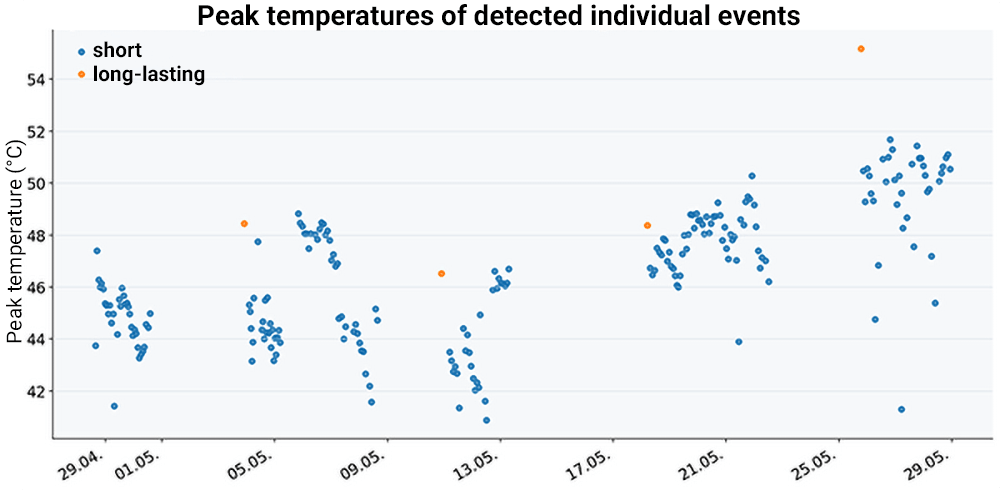
In addition to the spatial distribution, the temporal development is also critical. For the short-duration events analyzed, linear trend analysis showed a temperature increase of approximately 0.17 °C per day. Over the four-week measurement period, this corresponds to a change of around 5.2 K. As this trend was also observed relative to the local baseline, the measured change cannot readily be attributed solely to a general increase in ambient temperature. However, given the relatively short observation period, this result alone is not sufficient to conclude that the equipment is undergoing technical deterioration.
Two approaches to assessing thermal anomalies
Monitoring using fixed temperature thresholds
In threshold-based monitoring, a temperature limit is defined for an individual measurement point or a specific area of the system. If this threshold is exceeded, an alert can be triggered. This approach is particularly suitable for monitoring clearly defined temperature ranges.
In the study, thresholds of 50 °C for individual measurement points and 35 °C for the control cabinet median were considered as examples. Such thresholds can serve as an additional monitoring layer for early fire detection in control cabinets.
Continuous temperature monitoring can therefore also support fire prevention in electroplating facilities. Unusual temperature increases become visible, allowing those responsible to investigate anomalies and implement appropriate measures when necessary.
At one of the electroplating facilities studied, 16 separate periods were recorded in which temperatures exceeded 50 °C, totaling approximately 575 minutes. No critical shutdown threshold was reached, either at individual measurement points or for the control cabinet median. At the other facilities examined, the observed peak temperatures remained around 40 °C.
Adaptive condition monitoring
Greater transparency for predictive maintenance and early fire detection
The measurement study across the three electroplating facilities clearly demonstrates the additional insights that high spatial and temporal resolution temperature monitoring can provide.
Rather than focusing solely on individual measurement points or snapshots, continuous monitoring reveals where thermal anomalies occur, how long they persist, and how they evolve over time. By combining spatially distributed measurement points with continuous data acquisition, Flexora provides a more comprehensive picture of a system’s thermal condition than spot measurements or individual thermal images alone. The sensor films can be integrated into existing installations quickly and non-invasively, including at hard-to-reach locations and without interrupting ongoing operations.
For electroplating facilities, this translates into greater transparency, enhanced safety, improved equipment availability, and better operational planning. Thermal anomalies can be detected and assessed at an early stage, maintenance activities can be planned more precisely, and equipment condition trends can be documented over the long term. Flexora helps operators identify potential risks early, reduce unplanned downtime and associated costs, and improve equipment availability. At the same time, continuous data acquisition creates a valuable dataset for internal condition assessments and optimization, as well as external documentation, for example, for insurance providers.
Protect your facility with predictive fire prevention. Use Flexora sensor foils to detect local hotspots and critical temperature trends before they lead to serious damage.